Part One | Part Two | Part Three
Whitespace’s analytics measure potential contacts between persons who do not live together. By analyzing the location of mobile devices, our analytics provide actionable intelligence about the spatial distribution of transmission risk weeks before changes in the number of cases, hospitalizations, and deaths are observed. Metrics constructed using potential contacts can be used to inform calibration of the infectious disease transmission models used by governments and businesses, producing more accurate forecasts of disease incidence across regions.
Using the process outlined in the sections that follow, our potential contacts analytics produce three data products that have unique epidemiological intelligence value:
Reports metrics for locations where transmission may be occurring outside the home: public parks, grocery stores, beaches, private gatherings. Possible policy actions include issuing or enforcing distancing regulations, public health messaging, provision of personal protective equipment (masks, gloves) if contact is unavoidable, and enhanced sterilization and cleaning protocols.
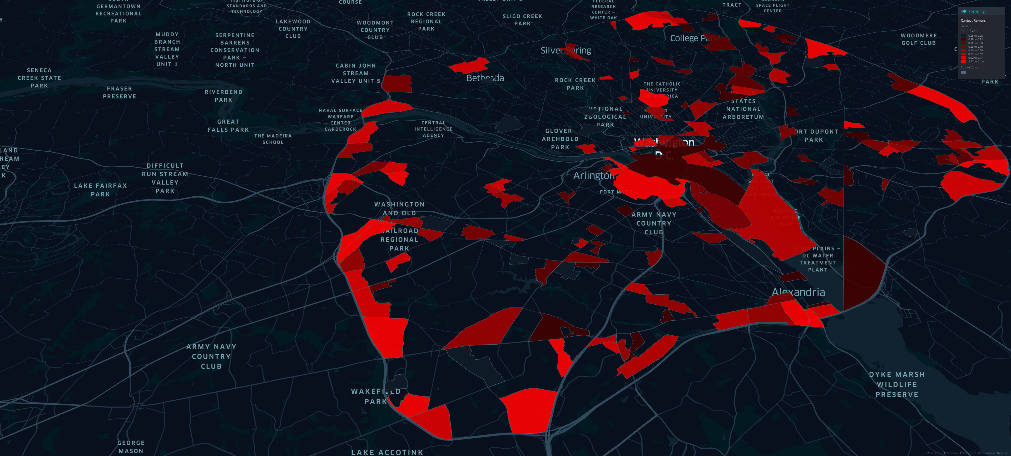
Figure 5: Potential Contacts by Area – DC Beltway Region, April 1st, 2020
Reports metrics for the home regions of individuals who have experienced close potential contacts outside their home and are therefore at higher risk of infection. Because illness occurs many days following infection due to contact with another infected person, and because people tend to stay at home when they are ill, home locations provide insight into where infected people are likely to be after the onset of symptoms. According to the CDC, the delay can be as long as two weeks after initial infection[i]. This lag between contact and onset gives public health officials some lead time to take corrective action. When they see a spike in a home region, they can focus enhanced testing, screening, or interventions designed to detect and isolate infected individuals, or increase protection measures for nearby vulnerable populations. They can even alert nearby medical facilities of the risk of a potential surge before it occurs.
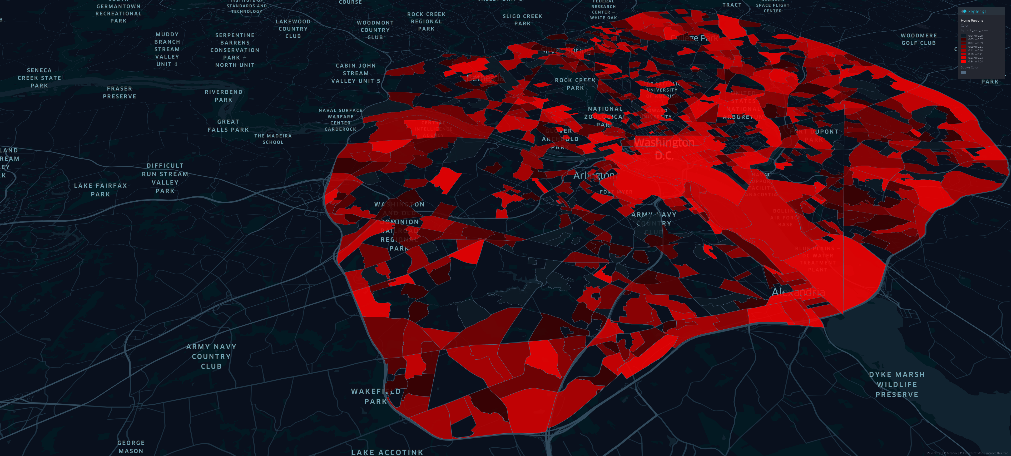
Figure 6: Potential Contacts per device by Home Region – DC Beltway Region, April 1st, 2020
Reports relational information about contacts within and across geographic areas, which can be leveraged to calibrate COVID-19 transmission models, providing better projections of future disease incidence and hospitalization. Understanding regional patterns of contact across geography may also help inform intervention efforts: when a high level of cross-contact between different regions is observed, travel prohibitions between those locations could reduce transmission. If the infection rate in one location is known to be high, enhanced testing and disease surveillance in other locations could be ramped up according to the cross-contact connections between them.
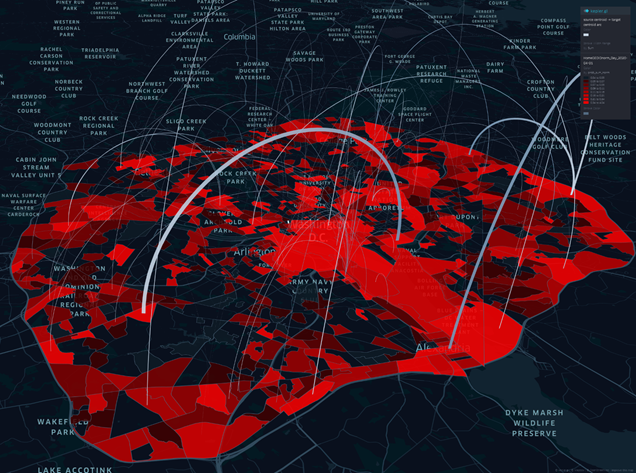
Figure 7: Potential Contacts Network – DC Beltway Region, April 1st, 2020
Whitespace Solutions’ core competency is Spatial Data Analytics (SDA)[ii]. In order to identify potential contact events from human mobility data, we adapted activity-based SDA processing used to extract patterns of co-location. Co-location events are analyzed across space, time, and individual devices to assess the potential that two or more people carrying mobile devices came into direct social contact with one another. Co-location behavior consistent with a high probability of direct social contact is the basis for our concept for deriving our surrogate metric for contact rate at the community level: potential contacts.
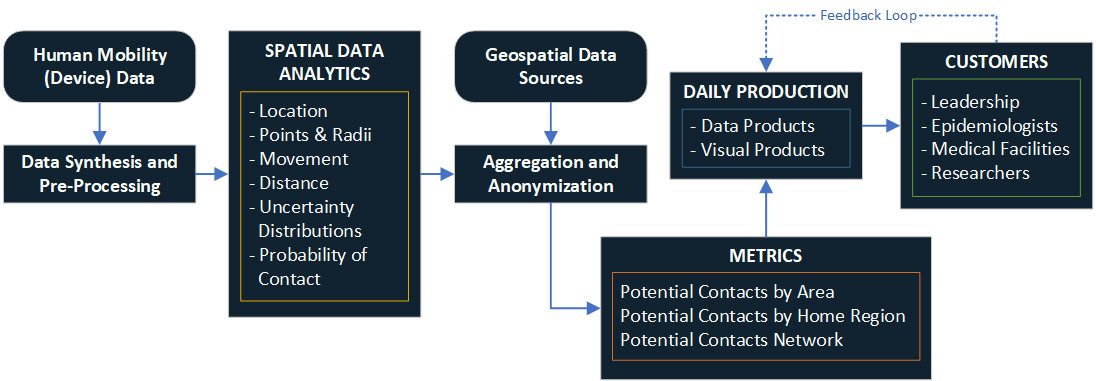
Figure 8: Processing and Reporting Overview Diagram
Our pipeline is designed to extract points, radii, and movement to ascertain whether anonymized observations of different devices overlap spatially and temporally within given thresholds. Activities extracted from mobility data are analyzed based solely upon the knowledge that they pertain to pairs of distinct devices that are observed to be nearby one another[iii]. Potential contacts are aggregated by census block group (CBG) by day, as is information about infection risk by home location, and inter-regional networks of infection risk.
For each potential contact (PC) event, the pair probability of contact (PPC) is calculated which indicates the probability that a contact was close enough (e.g. within two meters) for infection transmission to occur if an individual were infectious. These metrics are then aggregated to the census block group or health district, and up to the county, state, and regional levels as indicators of infection risk by area. These metrics are reported at the census block group level both for the census block group where the potential contacts occurred (potential contacts per area), as well as by the “home” census block group for each of the devices involved in a potential contact event (potential contacts per resident). The anonymization and aggregation we apply ensures that no individual device’s activities can be identified, as our metrics are representative models of aggregate mobility data.
Finally, the pipeline produces networks of regions, linked through contact events for a given time period. This facilitates an understanding of how regions are linked through potential contact events. Just as with the potential contacts by area and potential contacts by resident metrics, the matrix of potential contacts between individuals across regions can emphasize where potential contacts occur as nodes, or the regional infection risk as nodes, with network links being the weighted probability of contact between devices visiting or residing in a region respectively (see Figure 7).
While mobility metrics provide insight into compliance with stay-at-home orders, they do not directly measure a key driver of COVID-19 transmission. In contrast, daily reporting on where, when, and how contact rate is changing provides direct insight into infection risk as shelter-in-place guidelines are lifted and reinstated across the country. By combining expertise in SDA and epidemiological modeling to analyze mobility data, Whitespace Solutions’ and Dr. Forrest W. Crawford, Professor of Biostatistics, have developed potential contacts analytics designed to inform more accurate forecasts of COVID-19 infectious disease transmission and help decision-makers understand the spatial distribution of transmission risk over time as conditions change.
[i] CDC, “Coronavirus Disease 2019 (COVID-19) – Symptoms.”
[ii] SDA uses the spatiotemporal attributes of data to uncover otherwise hidden relationships between events, entities, and locations.
[iii] In order to account for cases that could be observed in the data, but do not drive disease transmission, we take steps to identify these events. We specifically look for potential contacts with a high pair probability of contact that may be produced by: (1) a single device being captured as a unique device in each dataset, (2) an individual carrying two different devices, or (3) individuals who share a household who travel outside of the home together.
Buckee, Caroline O., Satchit Balsari, Jennifer Chan, Mercè Crosas, Francesca Dominici, Urs Gasser, Yonatan H. Grad, et al. “Aggregated Mobility Data Could Help Fight COVID-19.” Science 368, no. 6487 (April 10, 2020): 145–46. https://doi.org/10.1126/science.abb8021.
Burstein, Roy, Hao Hu, Niket Thakkar, Andrew Schroeder, Mike Famulare, and Daniel Klein. “Understanding the Impact of COVID-19 Policy Change in the Greater Seattle Area Using Mobility Data,” n.d., 8.
CDC. “Coronavirus Disease 2019 (COVID-19) – Symptoms.” Centers for Disease Control and Prevention, May 13, 2020. https://www.cdc.gov/coronavirus/2019-ncov/symptoms-testing/symptoms.html.
Whitespace Solutions. “Contact Metrics.” Accessed July 15, 2020. http://www.whitespace-solutions.com/analytics/contact-metrics.
COVID-19 Community Mobility Report. “COVID-19 Community Mobility Report,” April 25, 2020. https://www.google.com/covid19/mobility.
Social Distancing Reporter. “COVID-19 County Social Distancing Reporter,” April 25, 2020. https://covid19.cambersystems.com/.
COVID-19 Mobility Data Network. “COVID-19 Mobility Data Network,” April 25, 2020. https://www.covid19mobility.org/.
“Covid-19 Social Distancing Scoreboard — Unacast,” April 25, 2020. https://www.unacast.com/covid19/social-distancing-scoreboard.
Cuebiq. “Cuebiq’s COVID-19 Mobility Insights.” Accessed May 12, 2020. http://help.cuebiq.com/hc/en-us/articles/360041285051.
Descarteslabs/DL-COVID-19. Python. 2020. Reprint, Descartes Labs, 2020. https://github.com/descarteslabs/DL-COVID-19.
COVID-19 Mobility Data Network. “Facebook Data for Good Mobility Dashboard,” April 11, 2020. https://www.covid19mobility.org/dashboards/facebook-data-for-good/.
Klein, Brennan, Timothy LaRock, Stefan McCabe, Leo Torres, Filippo Privitera, Brennan Lake, Moritz U G Kraemer, et al. “Assessing Changes in Commuting and Individual Mobility in Major Metropolitan Areas in the United States during the COVID-19 Outbreak,” n.d., 29.
Kunkel, Christian. “COVID-19 Mobility Insights.” Cuebiq, April 25, 2020. https://www.cuebiq.com/visitation-insights-covid19/.
Facebook Data for Good. “Our Work on COVID-19,” April 25, 2020. https://dataforgood.fb.com/docs/covid19/.
“SafeGraph COVID-19 Data Consortium,” April 25, 2020. https://www.safegraph.com/covid-19-data-consortium.
Thompson, Stuart A., Yaryna Serkez, and Lora Kelley. “Opinion | How Has Your State Reacted to Social Distancing?” The New York Times, March 23, 2020, sec. Opinion. https://www.nytimes.com/interactive/2020/03/23/opinion/coronavirus-economy-recession.html.
Warren, Michael S., and Samuel W. Skillman. “Mobility Changes in Response to COVID-19.” ArXiv:2003.14228 [Cs], March 31, 2020. http://arxiv.org/abs/2003.14228.

