Happy Super Bowl Weekend!
Last year, Super Bowl LV was one of the first events with nation-wide participation since the beginning of the COVID-19 pandemic. At the time, Florida was one of the states with the highest COVID-19 rates (for transmission, cases, hospitalizations, deaths, etc.). The Super Bowl was scheduled to be hosted – with limited attendance – in Tampa, Florida at Raymond James Stadium. We were interested to see if the Super Bowl had potential to be a “Super Spreader Event,” or SSE.*
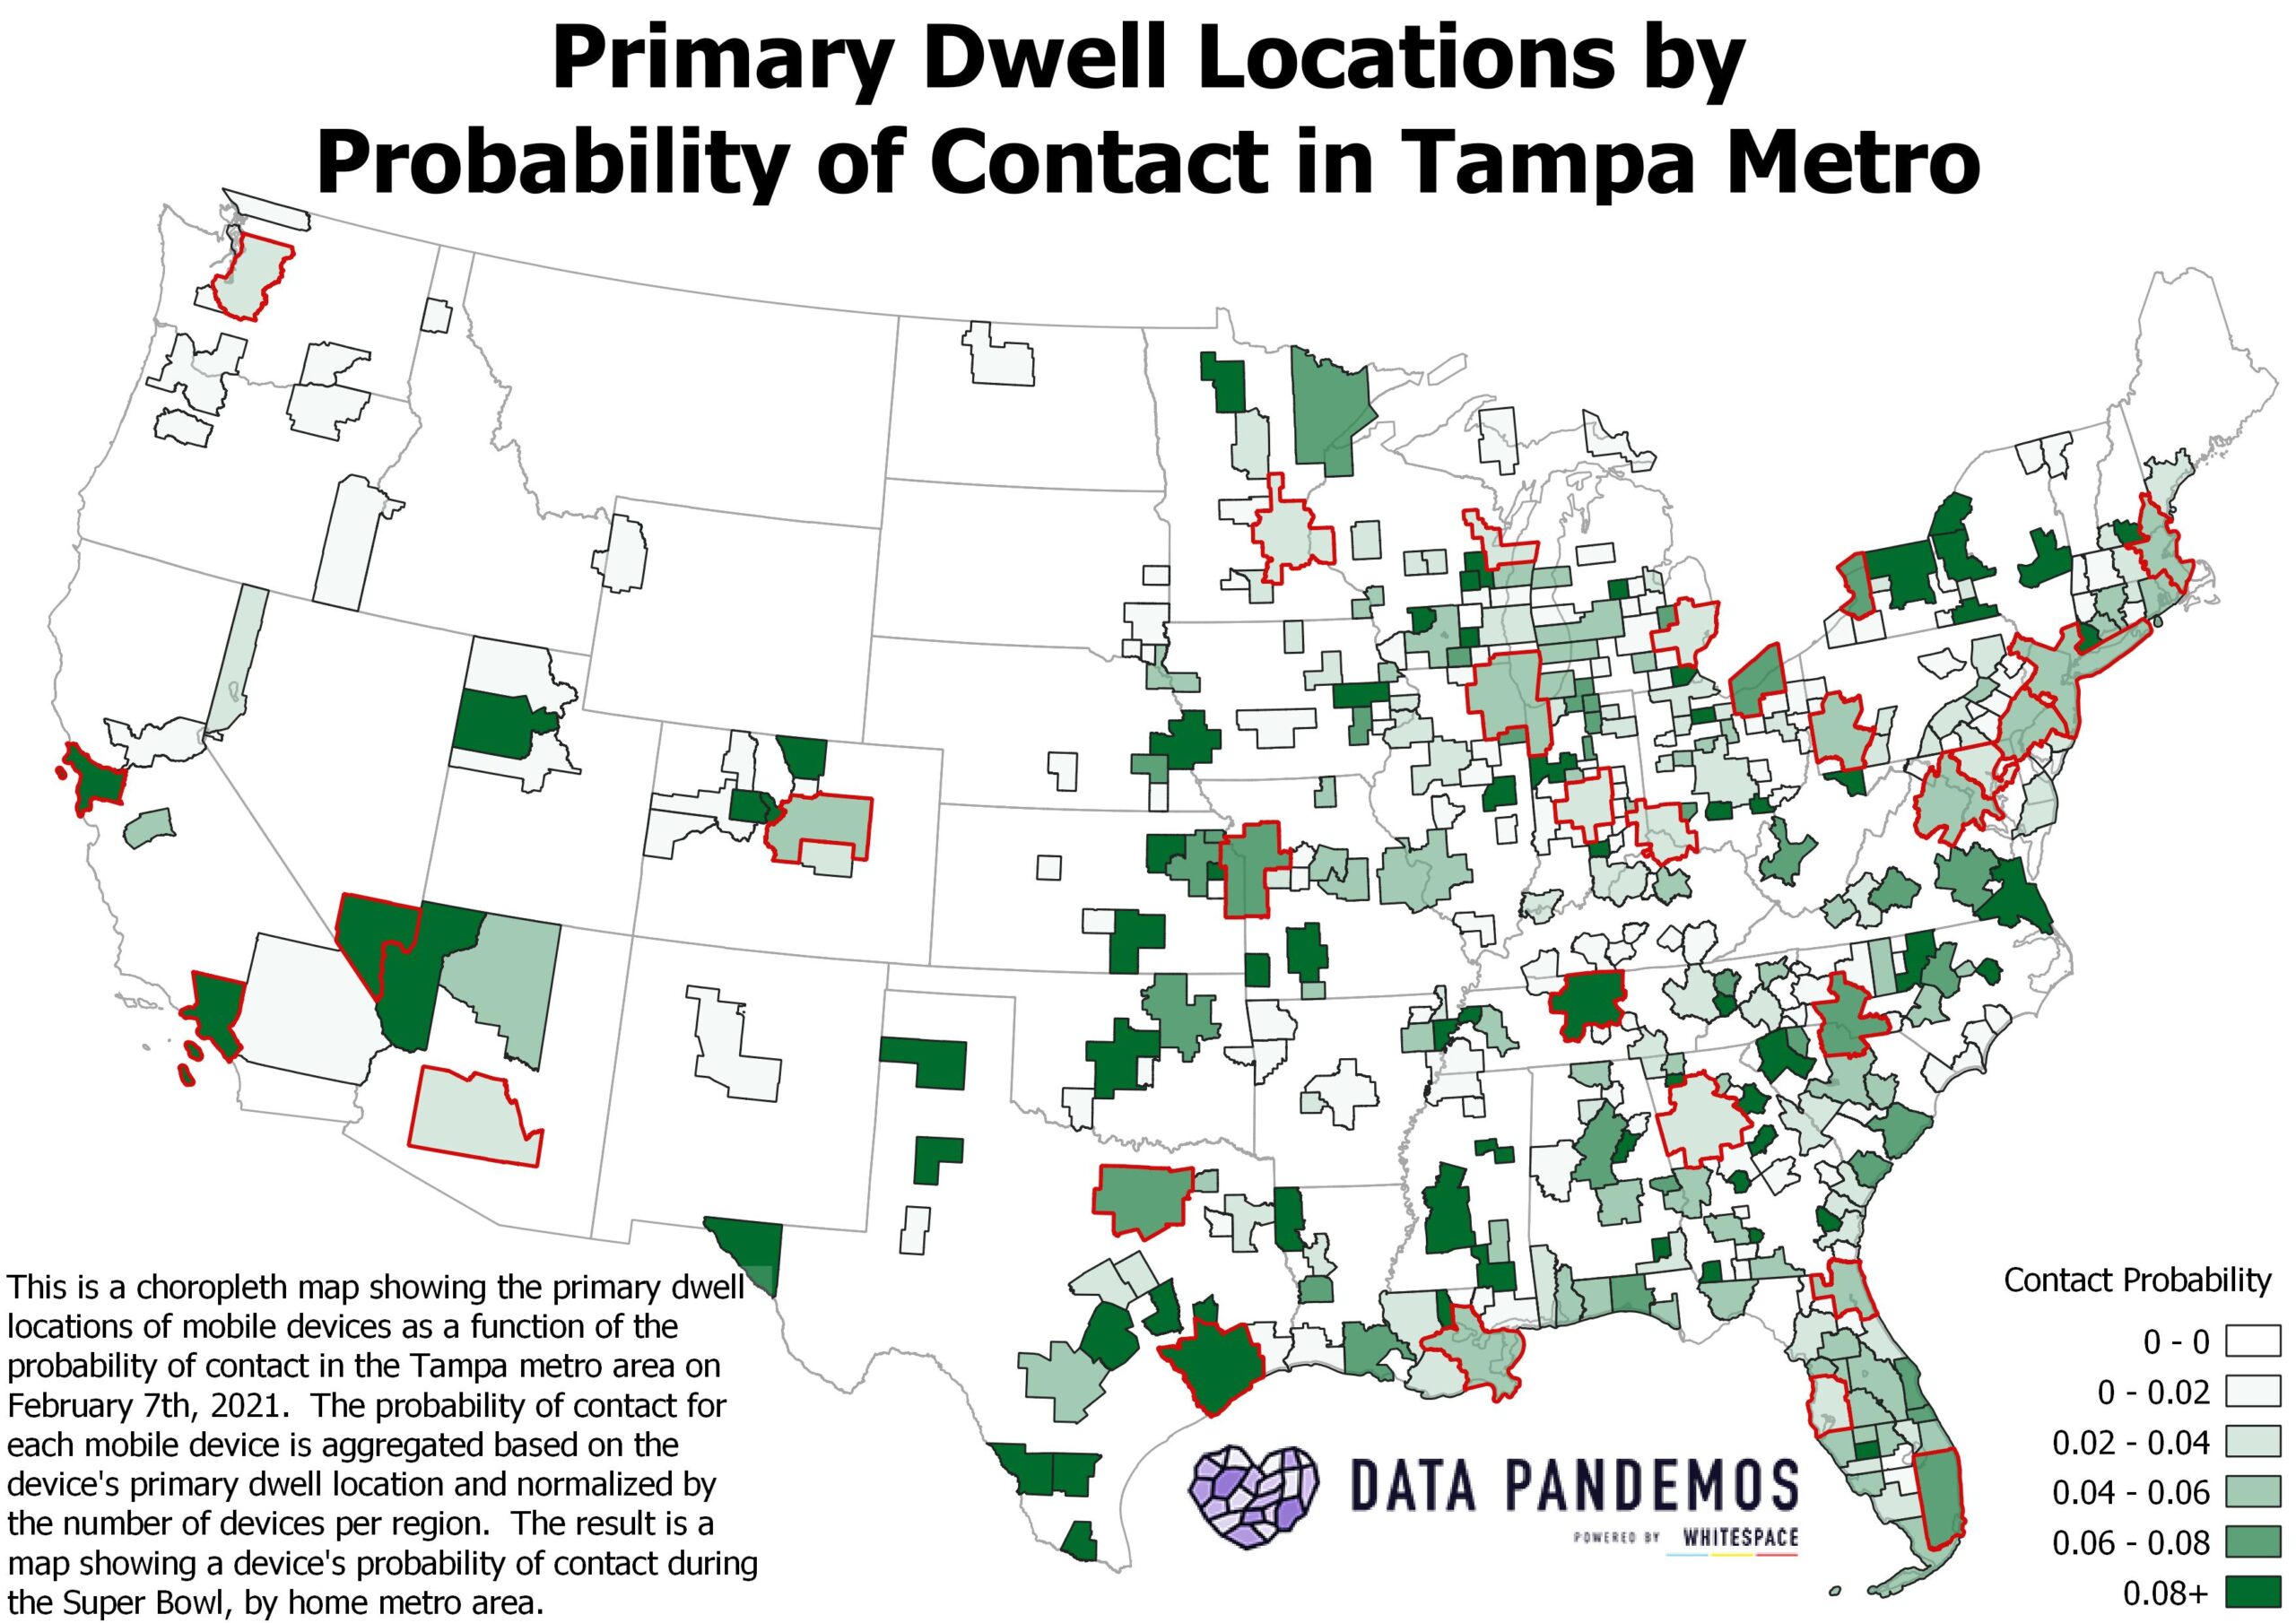
We took an aggregated sample of devices located in the Tampa Metro Area over the course of the weekend (Fri. 5 Feb 2021 – Mon. 8 Feb 2021) and used our Contact Metrics to determine those devices’ probability of contact during the Super Bowl. We also looked at the primary dwell locations of those devices to gain an understanding of where people may have travelled from in order to attend the game.
Below, we visualized this probability of contact with a simple choropleth map. The darker green indicates a higher probability of contact. A lighter green (or white) indicated a lower probability of contact. Regions outlined in red highlight the locations of NFL franchise stadiums.
We are ready to take a look at Super Bowl LVI in Los Angeles, California this weekend. Stay tuned for an exciting analysis!
To read more about our Contact Metrics, start here.
*A super spreader event is a gathering in which one infectious person infects many others. They are also associated with explosive early growth and sustained transmission.

